Historical visualization
Visual communication tools playing the leading role in forming and demonstration of the social achievement to the modern civilisation.
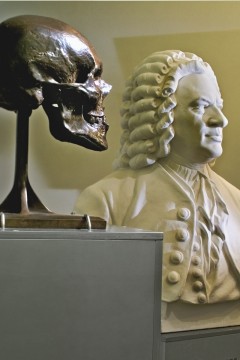
Widespread usage of visual methods for submission of the socially significant information, by our view, becomes an incentive way to utilize these n in the distribution and popularization of historical scientific knowledge.
This strong demand of visual tools explained to the high informative of images than with other communication methods. In general – visualization (from Latin visualis – optical) is an action to information and knowledge representation in the form of focusing on optical (visual) perception. The purpose of visualization is to present information ad oculos in structurally clear, easily digestible form. 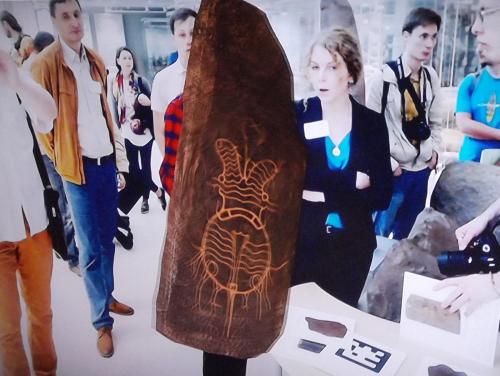
The convergence of the latest achievements of neuropsychology in the field of perception, art culture in the graphic design and possibilities of information technology in the field of computer graphics led to the formation in the second half of the 80-ies of the last century a multidisciplinary field of scientific visualization. Scientific visualization – representation in the visual form of scientific data and research results. Considering the final objectives we can distinguish a two kinds:
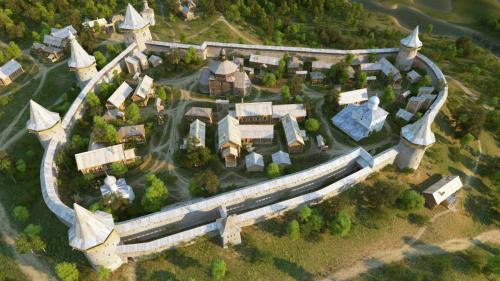
- Research visualization – aims to clearly presents current research data in the most convenient form for it's understanding by researchers, of their analysis and evaluation, as well as for communication between scientists.
- Educational (popular science) visualization – easy and clearly illustrates results of the study (the current state of knowledge in this field) for a specific audience in order to spread and promote knowledge, enlightenment.
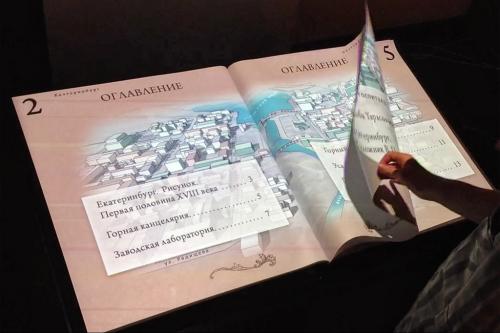
One of the divisions of scientific visualization is the historical visualization – activities for historical evidence and knowledge presentation in visual form. Various forms of historical visualization can be grouped according to the basis characteristics:
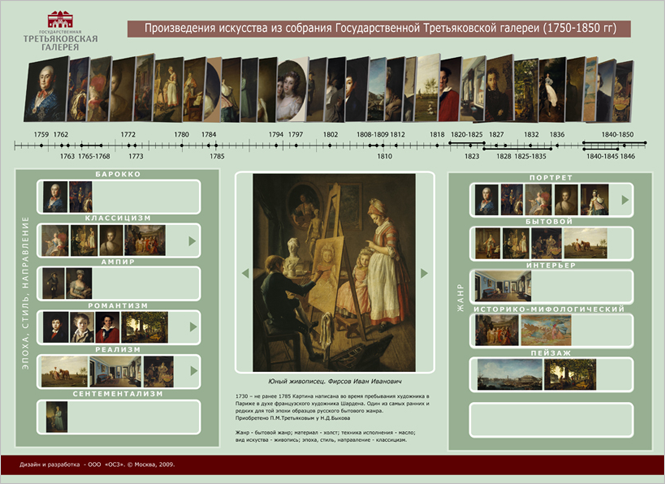
- Actors of history
- Artifacts
- Documents (sources)
- Time
- Space
- Processes
- Connections (ties)
For our opinion the following historical forms of digital visualization are perspective:
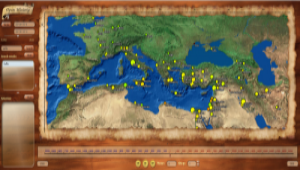
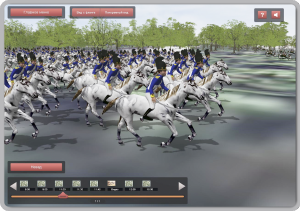
- Anthropological reconstruction
- Artifacts modeling
- Architectural reconstruction
- Digital documents representation
- Chronoline (Time line)
- "Live" map
-
Process reconstruction
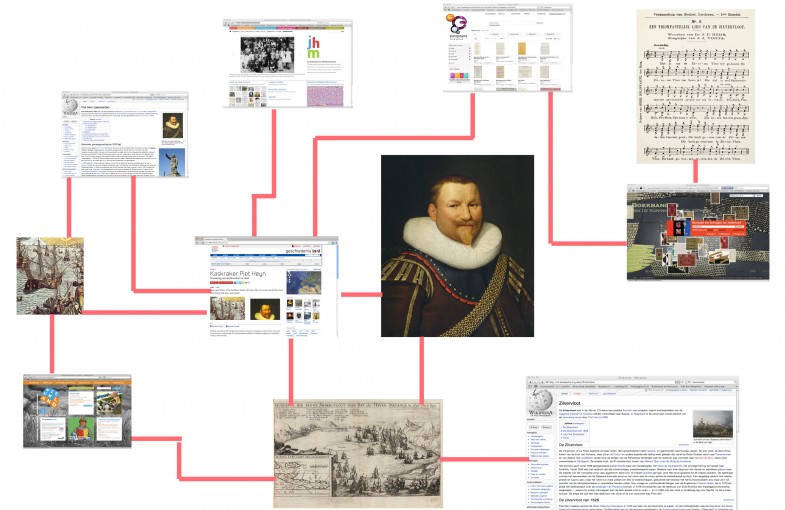
- Networks and geneology trees
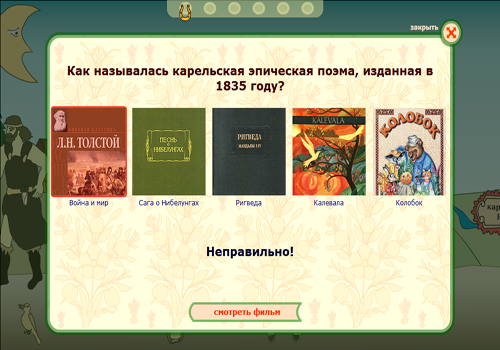
- Quizzes and games
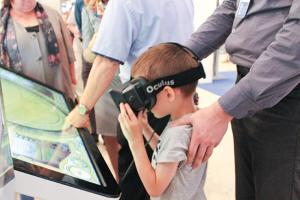
- Virtual tours
Due to the interdisciplinary nature, actual quality of visualisation can be achieved only through the cooperation of professionals from different areas.
 Various specialists are responsible for their specific areas and should harmonically complement each other: historians – determine the overall concept, theme and composition of visual tools, collect reliable facts and compile descriptions, conduct verify results; designers – determine the optimal shape, color and graphic solutions; developers – select the required range technologies and equipment, produce software.
A participation of professional historian is especially important, so that created visualization does not contain inaccuracies and errors, and finally, has not appeared as profanation. Thus, only the coordinated interaction within the team of specialists ensures the success of visualization.
Quality application of historical visualization tools enables fast, easy and beautiful demonstraton of the complex historical objects and processes - that allows to strengthen research capacity and to make acquaintance with the history interesting and comprehensible for a wide audience[1].
Nikolay Bystritskiy
PDF: 
Bystritskiy N. (2015). Istoricheskaya Vizualizatsia. In Information bulletin of Association "History and Computer". V. 44. Kaliningrad: Kant's BFU. PP. 78–81. (in Russian).
This publication was developed within project, supported by Russian Scientific Fund (aggrement № 14–28–00213)
[1] Staley D.J. Computers, Visualization, and History: How New Technology Will Transform Our Understanding of the Past. (2013) London: Routledge.
- Войдите или зарегистрируйтесь, чтобы отправлять комментарии
- Русский


Новые комментарии